Turn Analysis
The Turn Analysis Overlay offers a detailed visual comparison of your speed trace against the coach or reference lap for the most recently completed corner. It is designed to help you understand where you were too fast, too slow, or well-matched throughout the corner.
Reference
Section titled “Reference”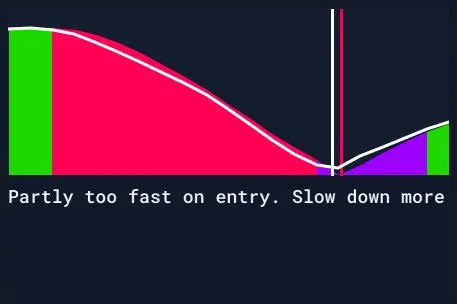
This overlay compares your speed to the coach’s speed during the most recently completed corner. It helps you understand where your driving deviated from the ideal reference.
Key Elements Breakdown
Section titled “Key Elements Breakdown”| Element | Description |
|---|---|
| White Line | Represents the coach’s speed trace throughout the corner. |
| Colored Area | Represents the user’s speed. Colored to indicate performance: green = matched, red = too fast, purple = too slow. |
| Vertical Lines | Indicate the slowest point (“midpoint”) of the corner. White = coach midpoint, colored = user midpoint. |
| Text Feedback | A message under the graph summarizing the key area for improvement. |
Midpoint Definition: The midpoint is defined as the slowest point of the corner. This is typically the moment the car reaches maximum rotation and transitions from slowing down to accelerating.
These segments are mapped across the full corner, providing clear feedback on performance phase by phase.
Note: Being too fast on entry can lead to reduced control, excessive tire wear, and compromised exits. Being too slow leads to time loss.
Examples
Section titled “Examples”Here are some examples to help you interpret the visuals. Once you’re comfortable reading the plot, you may choose to resize the overlay to hide the text for a cleaner display.
Overdriving
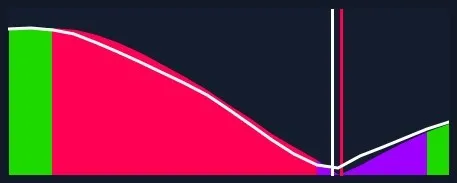 In this example, the user enters the corner too fast, missing the correct midpoint and losing exit speed as a result.
Underdrive
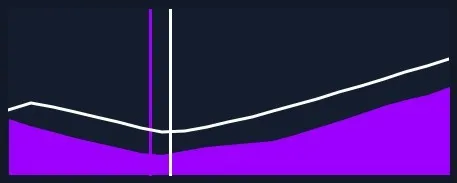 Here, the user is underdriving the car—there’s significant potential to carry more speed through the corner. The midpoint is also set too early, likely due to the overly conservative entry.
Mix
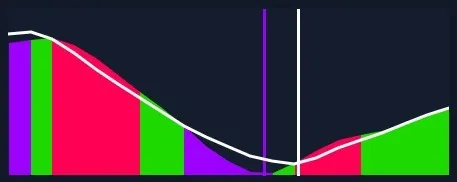 This is a good example of a mixed scenario. The user enters slower than expected but brakes too late. Heavy braking overcorrects the speed, leading to a premature midpoint and early throttle application. A second lift is needed, reducing exit speed.
Note: The written advice always prioritizes preventing overdriving and achieving a correct midpoint before suggesting carrying more speed. This ensures the car remains balanced and the exit is strong, which is especially important in iRacing where overdriving can easily lead to tire overheating and poor corner exits.
Usecase
Section titled “Usecase”Use the Turn Analysis Overlay to:
- Diagnose where you are loosing time - corner per corner.
- Spot overdriving behavior such as excess entry speed.
- Identify opportunities to carry more speed through specific parts of a corner.
- Get quick, visual feedback without interpreting raw telemetry.
- Receive concise written feedback highlighting the most important improvement for your next attempt.
This is an ideal overlay for building corner-by-corner consistency and learning how minor speed differences impact total performance.
Settings
Section titled “Settings”There are no adjustable settings for this overlay.
- It is always shown in the same format.
- As with other overlays, size and position can be freely adjusted.
- Don’t forget to click Save Positions after moving it.
The Turn Analysis Overlay is one of the most effective tools for understanding corner speed performance at a glance and should be part of any structured self-review process.