KPIs
The KPI Overlay in VirtualCoach provides a compact overview of three critical speed-based performance metrics. These Key Performance Indicators (KPIs) allow you to quickly assess how you performed in a corner compared to the coach or reference lap.
Reference
Section titled “Reference”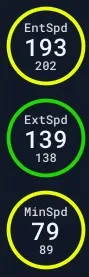
This overlay displays side-by-side comparisons of speed values at different phases of the corner.
Display Breakdown:
Section titled “Display Breakdown:”| Metric | Description |
|---|---|
| EntSpd | Entry Speed — Your speed when entering the corner. |
| MinSpd | Minimum Speed — Your slowest speed in the corner (midpoint). |
| ExtSpd | Exit Speed — Your speed at the end of the corner. |
Each circular display shows:
- Top Number: Driver’s current session value.
- Bottom Number: Reference/coach value for comparison.
- Ring Color: Indicates performance match or issue:
- Green = similar to reference
- Yellow = small deviation
- Red = large deviation (too slow)
- Blue = faster than reference (possibly too fast)
Usecase
Section titled “Usecase”The KPI Overlay is ideal for:
- Spot-checking if your entry, minimum, or exit speeds match your target.
- Identifying if time loss is due to poor corner entry or slow exit.
- Getting a fast performance summary without needing to analyze graphs.
It works especially well when paired with the Turn Analysis and Turn Rating overlays.
Settings
Section titled “Settings”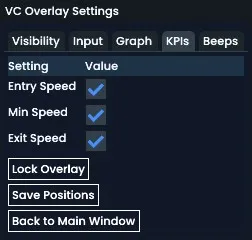 Access the KPI settings under Adjust Overlay > KPIs tab.
| Setting | Description |
|---|---|
| Entry Speed | Toggle the Entry Speed metric display. |
| Min Speed | Toggle the Minimum Speed display. |
| Exit Speed | Toggle the Exit Speed metric display. |
As with other overlays, size and position can be freely adjusted. Remember to click Save Positions after making changes.
The KPI Overlay provides an efficient at-a-glance performance check and helps prioritize areas for improvement without deep data analysis.