Graph
The Graph Overlay in VirtualCoach provides a detailed visualization of your driving inputs and telemetry over time. It is intended as a reference tool to help you interpret and evaluate your performance on track.
Reference
Section titled “Reference”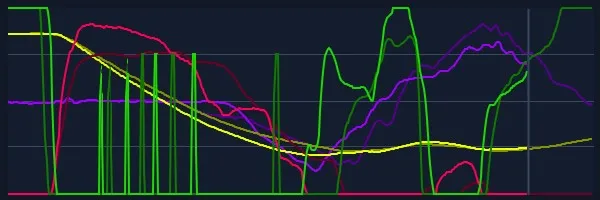
The Graph Overlay displays multiple data lines simultaneously, with each line representing a specific input or telemetry signal. Brighter-colored lines indicate the driver’s live data, while darker-colored lines show coach or reference data.
On the right side of the graph, you’ll often see only the darker lines—this represents reference data for the upcoming section of the track where no current driver input is yet available.
Use Case
Section titled “Use Case”The graph overlay presents raw, unfiltered telemetry data, making it especially useful when you have a specific question or hypothesis. For example, you might want to investigate: “Does the coach brake at a different point?” or “Am I steering too much in this corner?” It can also be used to reveal finer details that other overlays may not explicitly show.
If such questions arise, simply bring up the graph and review the relevant section. You can do this at any time during a session, as all data is continuously recorded—even for inputs that weren’t actively displayed at the session’s start.
For experienced users who know exactly what they are looking for, the graph overlay can serve as a powerful starting point for deeper performance analysis. However, for most drivers, it is best used as a supporting tool rather than the primary method of review.
Settings
Section titled “Settings”Beside the size and positions these settings can be adjusted under Adjust Overlay > Graph tab.
| Setting | Description |
|---|---|
| Plot Throttle | Show/hide throttle input (green line) |
| Plot Brake | Show/hide brake input (red line) |
| Plot Clutch | Show/hide clutch input (pink line) |
| Plot Speed | Show/hide speed data (yellow line) |
| Plot Steering | Show/hide steering angle (purple line) |
| Plot Gears | Show gear shift indicators (white line) |
| Hide Reference | Hide reference lap data if loaded |
| Graph Points | Total number of data points to be visualized (e.g., 480). The more, the longer data is shown. |
| Future Points | Number of points shown ahead of the car’s current position (e.g., 60). Set to zero to disable it. |
Use these settings to reduce visual clutter or focus on specific inputs. They can be adjusted at any time, even during a session—simply unlock the overlay and make your changes. All input data is continuously recorded and will appear in the graph, even if a particular input was not initially enabled when the session began.
Additional Notes
Section titled “Additional Notes”- The graph can be moved and resized. Use Save Positions to retain the layout.
- Best used alongside overlays like Turn Analysis for detailed corner-by-corner review.
- Lower Graph Points can provide a more focused view of recent input.
The Graph Overlay is a diagnostic reference that helps refine your technique and understand performance trends during driving sessions.